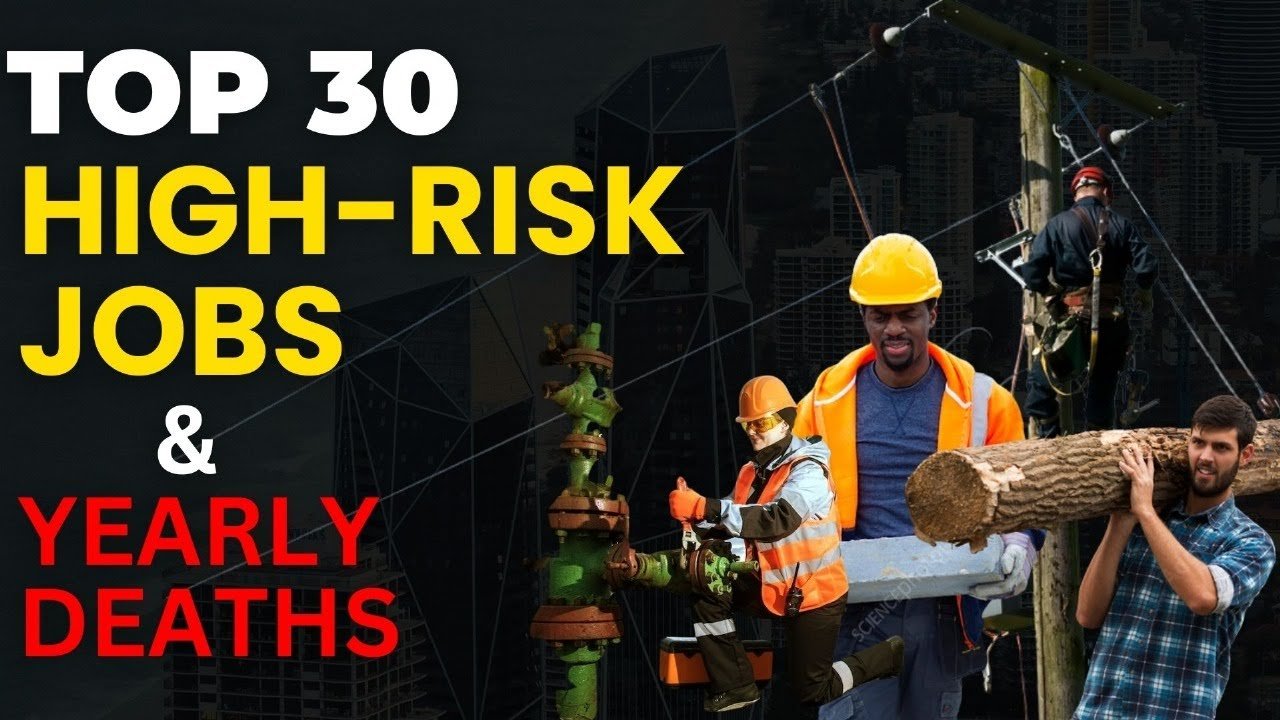
Are you curious about the most dangerous jobs in America? From construction to law enforcement, some careers involve serious risks every day. In this Articles, we count down the top 30 high-risk jobs in the US, highlighting the dangers these professionals face and the brave individuals behind them. Whether you’re interested in the oil industry, emergency services, or farming, you’ll find out which jobs rank highest in terms of danger and why. Stay safe, and let’s dive into the riskiest professions in the country!
| Rank | Job | Company | Injury Rate | Average Yearly Deaths |
|---|---|---|---|---|
| 30 | Stuntmen | Falls, Malfunctioning Equipment | 250/10000 Workers | 7 |
| 29 | Rideshre & grocery delivery drivers | Transportation Incidents | 14.6/10000 Workers | 7 |
| 28 | Oil & Gas Workers | Transportation Incidents | 46/10000 Workers | 7 |
| 27 | Pest Control | Exposure To Harmful Substances | 7/10000 Workers | 9 |
| 26 | Crane Operators | Transportation Incidents | 13/10000 Workers | 10 |
| 25 | Iran & Steel Workers | Falls | 32.5/10000 Workers | 17 |
| 24 | Freight, Stock, and Material Movers | Overexertion | 14/10000 Workers | 21 |
| 23 | Haavy Vehicle Mechanics | Contact With Objects/Equlipment | 13/10000 Workers | 25 |
| 22 | Firefighter | Falls | 470.2/10000 Workers | 26 |
| 21 | Cement Masons | Exposure To Harmful Substances | 22/10000 Workers | 30 |
| 20 | Mining | Falls | 1,400/10000 Workers | 32 |
| 19 | Fishing & Hunting Workers | Transportation Incidents | 203.6/10000 Workers | 44 |
| 18 | Security Guards | Work Violence | 7/10000 Workers | 46 |
| 17 | Mechanics | Sprain, strains, tears | 1668/10000 Workers | 54 |
| 16 | Extraction Workers | Transportation Incidents | 48.8/10000 Workers | 59 |
| 15 | Waste Colletion | Transportation Incidents | 33.1/10000 Workers | 59 |
| 14 | Electricians | Electrical Burns | 1,222/10000 Workers | 63 |
| 13 | Logging | Contact With Objects/Equipmenmnt | 91.7/10000 Workers | 63 |
| 12 | Pilots & Flight Engineers | Transportation Incidents | 53/10000 Workers | 80 |
| 11 | Highway Maintenance Workers | Transportation Incidents | 18/10000 Workers | 87 |
| 10 | Professional Athletes | Sprains | 15,421/10000 Workers | 100+ |
| 9 | Railroad Conductors | Falls,Broken Bones | 1800/10000 Workers | 100+ |
| 8 | Roofer | Falls | 47/10000 Workers | 102 |
| 7 | Landscapers | Falls | 1850/10000 Workers | 124 |
| 6 | Power line Workers | Electrocution | 15/10000 Workers | 126 |
| 5 | Farmers & Agricultural Workers | Contact With Equipment | 23/10000 Workers | 248 |
| 4 | Police Officers | Transportation Incidents | 1217/10000 Workers | 264 |
| 3 | Grounds Maintenance Workers | Falls, Malfunctioning Equipment | 20/10000 Workers | 307 |
| 2 | Truck drivers | Transportation Incidents | 20/10000 Workers | 307 |
| 1 | Construction | Falls | 43.4/10000 Workers | 1,008 |


